


http://govtslaves.info/2011/03/23/us-navy-map-of-the-future/
Earthquakes will be devastating.
US Navy Map Of The Future
Posted on March 23, 2011 by govtslaves
11

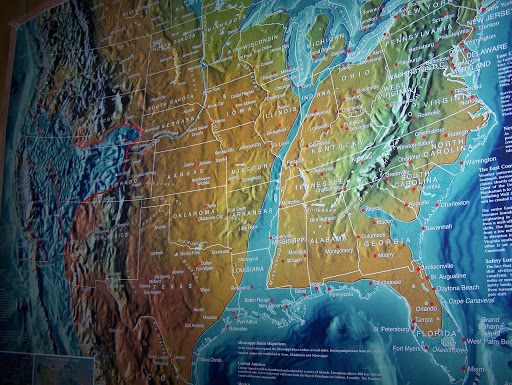
(ALT NEWS FORUM) US Navy Map representing the future geophysical landscape,consequences from the cosmic and geophysical events during 2011-2012.


GORDON MICHAEL SCALLION

FOUR MAPS – ALL VERY SIMILAR
SOURCES:
US Navy’s Earth Changes USA Flood Map, New Madrid Earthquake ZoneNLE 2011: What Does the Navy Know?US Navy Map Of The Future
Posted on March 23, 2011 by govtslaves
(ALT NEWS FORUM) US Navy Map representing the future geophysical landscape,consequences from the cosmic and geophysical events during 2011-2012.
GORDON MICHAEL SCALLION
FOUR MAPS – ALL VERY SIMILAR
SOURCES:
US Navy’s Earth Changes USA Flood Map, New Madrid Earthquake ZoneNLE 2011: What Does the Navy Know?US Navy Map Of The Future Posted on March 23, 2011 by govtslaves 11 USA-Map-NAVYd (ALT NEWS FORUM) US Navy Map representing the future geophysical landscape,consequences from the cosmic and geophysical events during 2011-2012. GORDON MICHAEL SCALLION FOUR MAPS – ALL VERY SIMILAR SOURCES: US Navy’s Earth Changes USA Flood Map, New Madrid Earthquake ZoneNLE 2011: What Does the Navy Know?