http://www.pccts.com/usa_plan_chaos_11_218_49/
Gas and oil, all related if this happens. Interesting map, check out the false front page. click on either one but the center one, the word and the sympbol and see what map comes up then click on the states.
jaime

The fight of small group of people in Northern Michigan against the oil and gas industry. All we want is it done safely and know the health hazards! Ah, the dreaded pink tape. Just two women who health has been so drastically changed since 2003 fighting the big boys and educating those who want to be educated and even those who don't.
Showing posts with label radiation. Show all posts
Showing posts with label radiation. Show all posts
Sunday, April 17, 2011


Friday, April 8, 2011
Interesting Radiation Map
GAS AND OIL WILL MEAN NOTHING IF ALL THIS HAPPENS. JUST FOR INFO, CURIOSITY
http://www.radiationnetwork.com/


Folks, we appreciate your interest in the Radiation Network, but please read the Message page in lieu of, or before emailing us. We update it as frequently as daily, and it will answer a lot of your questions.
Welcome to RadiationNetwork.com, home of the National Radiation Map, depicting environmental radiation levels across the USA, updated in real time every minute. This is the first web site where the average citizen (or anyone in the world) can see what radiation levels are anywhere in the USA at any time (see Disclaimer below).


 Nuclear Site Alert Level = 100 CPM
How the Map Works:
A growing number of Radiation Monitoring Stations across the country, using various models of GeigerCounters, upload their Radiation Count data in real time to their computer using a Data Cable, and then over the Internet to this web site, all of this accomplished through GeigerGraph for Networks software. This system is completely automated - there is no manual posting of data required.
How to Read the Map:
Referring to the Map Legend at the bottom left corner of the map, locate Monitoring Stations around the country that are contributing radiation data to this map as you read this, and watch the numbers on those monitoring stations update as frequently as every minute (your browser will automatically refresh). The numbers represent radiation Counts per Minute, abbreviated CPM, and under normal conditions, quantify the level of background radiation, i.e. environmental radiation from outer space as well as from the earth's crust and air. Depending on your location within the US, your elevation or altitude, and your model of Geiger counter, this background radiation level might average anywhere from 5 to 60 CPM, and while background radiation levels are random, it would be unusual for those levels to exceed 100 CPM. Thus, the "Alert Level" for the National Radiation Map is 100 CPM, so if you see any Monitoring Stations with CPM value above 100, further indicated by an Alert symbol over those stations, it probably means that some radioactive source above and beyond background radiation is responsible.
Notice the Time and Date Stamp at the bottom center of the Map. That is Arizona Time, from where we service the Network, and your indication of how recently the Radiation Levels have been updated to the Map.
How to Participate in the Nationwide Radiation Network:
If you want to join this nationwide grass roots effort to monitor the radiation in our environment, then this is all you need (click on the Software link):
In fact, if you become an active participant in this network (instead of just a passive viewer of this website), the GeigerGraph software that you use will incorporate the same Radiation Map as above, but your map will be fully interactive, with zoom capabilities, descriptions of Nuclear Sites and Monitoring Stations, additional Map Layers, including Counties, Airports, Roads, Railroads, Lakes and Rivers, and even the capability to download City Streets for your county. Plus, in keeping with the elements of a true Network, the GeigerGraph software has its own Chat forum.
Compatible Geiger Counter Models:
Most of these models, as well as the GeigerGraph for Networks software, are available at GeigerCounters.com, a web site operated by Mineralab. Click on the text hyperlinks in the previous sentence to go there. You can also contact us here:
Mineralab, LLC
2860 W. Live Oak Drive
Prescott, AZ 86305 USA
Folks, we appreciate your interest in the Radiation Network, but please read the Message page in lieu of, or before emailing us. We update it as frequently as daily, and it will answer a lot of your questions.
Email: minlab@mineralab.com
 Disclaimer: Mineralab, LLC, the operator of this web site, can not independently verify that the Radiation Levels, or any Radiation Alerts, that are displayed on this Radiation Map are correct and valid. Among other possibilities, Geiger counter malfunctions or proximity of the counters to certain medical procedures or to radioactive items can cause high readings at a Monitoring Station. If the Radiation Map appears to show elevated Radiation levels, contact Mineralab.
Click here for a Map of Japan
Click here for a Map of Alaska and Hawaii
Click here for a Map of Europe
http://www.radiationnetwork.com/
Welcome to RadiationNetwork.com, home of the National Radiation Map, depicting environmental radiation levels across the USA, updated in real time every minute. This is the first web site where the average citizen (or anyone in the world) can see what radiation levels are anywhere in the USA at any time (see Disclaimer below).
Nuclear Site Alert Level = 100 CPMHow the Map Works:
A growing number of Radiation Monitoring Stations across the country, using various models of GeigerCounters, upload their Radiation Count data in real time to their computer using a Data Cable, and then over the Internet to this web site, all of this accomplished through GeigerGraph for Networks software. This system is completely automated - there is no manual posting of data required.
How to Read the Map:
Referring to the Map Legend at the bottom left corner of the map, locate Monitoring Stations around the country that are contributing radiation data to this map as you read this, and watch the numbers on those monitoring stations update as frequently as every minute (your browser will automatically refresh). The numbers represent radiation Counts per Minute, abbreviated CPM, and under normal conditions, quantify the level of background radiation, i.e. environmental radiation from outer space as well as from the earth's crust and air. Depending on your location within the US, your elevation or altitude, and your model of Geiger counter, this background radiation level might average anywhere from 5 to 60 CPM, and while background radiation levels are random, it would be unusual for those levels to exceed 100 CPM. Thus, the "Alert Level" for the National Radiation Map is 100 CPM, so if you see any Monitoring Stations with CPM value above 100, further indicated by an Alert symbol over those stations, it probably means that some radioactive source above and beyond background radiation is responsible.
Notice the Time and Date Stamp at the bottom center of the Map. That is Arizona Time, from where we service the Network, and your indication of how recently the Radiation Levels have been updated to the Map.
How to Participate in the Nationwide Radiation Network:
If you want to join this nationwide grass roots effort to monitor the radiation in our environment, then this is all you need (click on the Software link):
 | Compatible Geiger Counter (See models below) |
| GeigerGraph Software and Data Cable |
| Computer with Windows Operating System |
| Internet Access (Direct connection preferred) |
Compatible Geiger Counter Models:
| The Geiger |
| Monitor 4 (yr 2008 redesign) |
| Radalert, Radalert 50 and Radalert 100 |
| Digilert 50 and Digilert 100 |
| palmRAD |
| CRM-100 |
| Inspector |
| Inspector EXP |
Mineralab, LLC
2860 W. Live Oak Drive
Prescott, AZ 86305 USA
Folks, we appreciate your interest in the Radiation Network, but please read the Message page in lieu of, or before emailing us. We update it as frequently as daily, and it will answer a lot of your questions.
Email: minlab@mineralab.com
Click here for a Map of Alaska and Hawaii
Click here for a Map of Europe
Sunday, March 27, 2011
radiation links
Interesting websites on the radiation from Japan. They are in French and I think Dutch but the maps tells it all.
http://www.irsn.fr/FR/popup/Pages/irsn-meteo-france_22mars.aspx
http://db.eurad.uni-koeln.de/prognose/data/alert/cs_hem_1h_movall_12.gif
http://www.zamg.ac.at/aktuell/index.php?seite=1&artikel=ZAMG_2011-03-18GMT09:52
http://www.zamg.ac.at/pict/aktuell/20110325_Reanalyse-I131-Bild5_gr.jpg
copy and paste them.
So it seems to be impacting all of the world. Just for your information.
jaime
http://www.irsn.fr/FR/popup/Pages/irsn-meteo-france_22mars.aspx
http://db.eurad.uni-koeln.de/prognose/data/alert/cs_hem_1h_movall_12.gif

http://www.zamg.ac.at/aktuell/index.php?seite=1&artikel=ZAMG_2011-03-18GMT09:52
http://www.zamg.ac.at/pict/aktuell/20110325_Reanalyse-I131-Bild5_gr.jpg
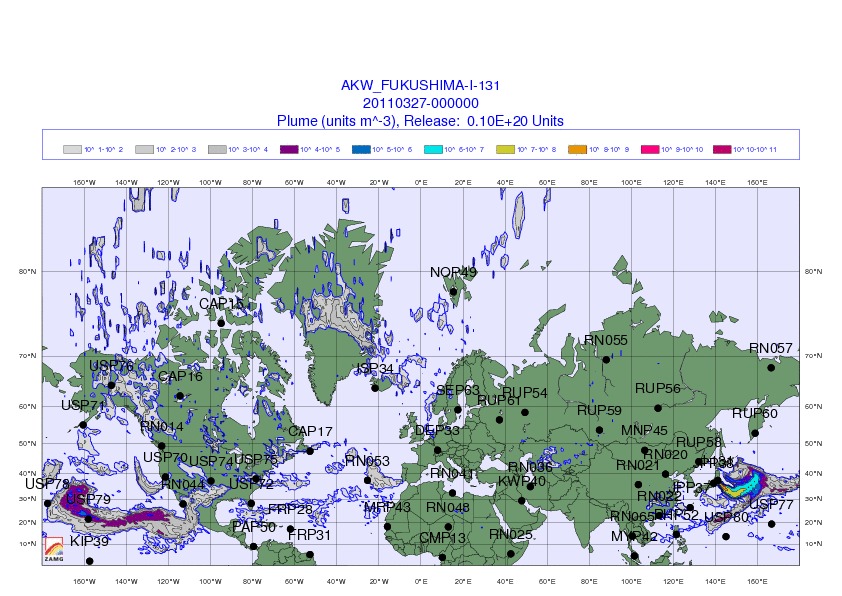
copy and paste them.
So it seems to be impacting all of the world. Just for your information.
jaime
Tuesday, March 15, 2011
Follow Radiation map! Get prepared!
http://www.zamg.ac.at/aktuell/index.php?seite=1&artikel=ZAMG_2011-03-15GMT08%3A26
Follow this link. It is in a different language but the pictures are what you want to look at that shows the radiation and it coming our way. Potassium Iodate or Potassium iodine, if you can find it (besides on ebay for $1000- someone should say something that is terrible!)
I hope this helps.
jaime
Northern Michigan
Follow this link. It is in a different language but the pictures are what you want to look at that shows the radiation and it coming our way. Potassium Iodate or Potassium iodine, if you can find it (besides on ebay for $1000- someone should say something that is terrible!)
I hope this helps.
jaime
Northern Michigan
Subscribe to:
Posts (Atom)